Master Charting on the MT5 Trading Platform
Discover what makes charting on the MT5 trading platform different and powerful for traders of all levels.
Traders searching for clarity amid market noise often find that their charting tools make all the difference between hesitation and confidence. The mt5 trading platform has earned a reputation among professionals for blending advanced charting capabilities with a clean, intuitive interface, giving traders the analytical depth they need without overwhelming complexity. This FAQ-style guide answers the most common questions about charting, technical indicators, timeframes, and analytical objects within this platform, helping traders of every experience level understand what sets it apart.
What makes charting on this platform different from basic trading tools?
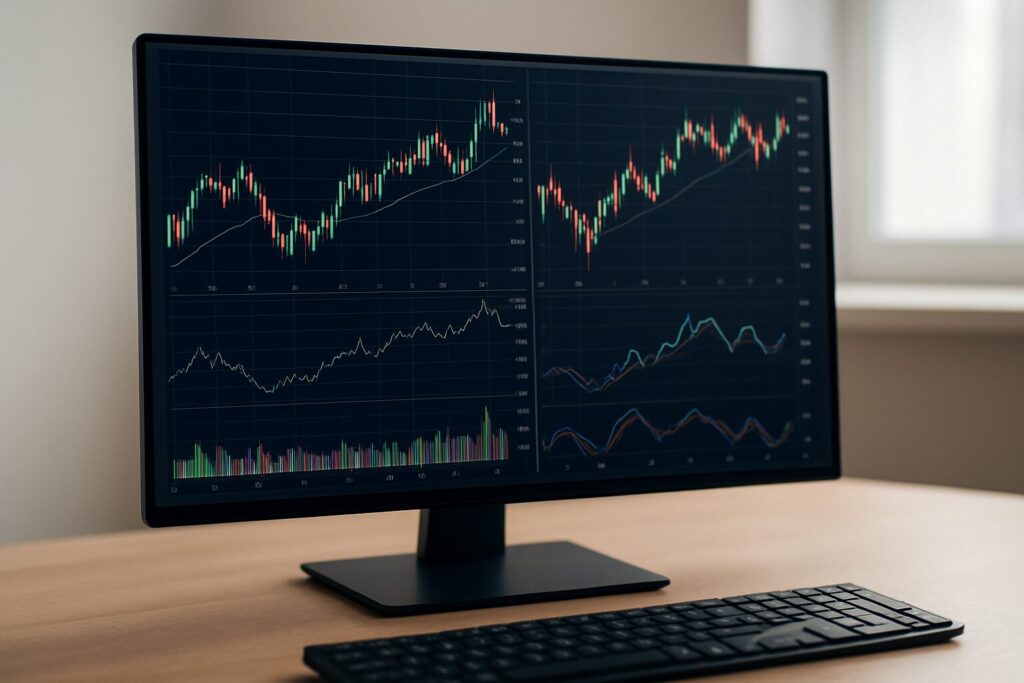
Charting on this platform goes far beyond simple price lines. Traders gain access to multiple chart types, including candlestick, bar, and line formats, each offering a distinct way to interpret price action. Layered on top of these visualizations is a flexible toolkit of drawing tools and analytical objects that allow traders to mark support zones, trendlines, channels, and Fibonacci levels directly on the chart. This level of customization helps traders build a personalized analytical workflow rather than relying on generic, one-size-fits-all views.
How many technical indicators are available, and how are they used?
The platform includes a wide library of built-in technical indicators spanning trend, momentum, volume, and volatility categories. Moving averages help identify directional bias, oscillators such as the Relative Strength Index highlight overbought or oversold conditions, and volatility-based tools like Bollinger Bands reveal periods of price compression or expansion. Traders can apply multiple indicators simultaneously, layering them to confirm signals before acting. Because these tools are fully customizable, parameters such as periods and calculation methods can be adjusted to match a trader’s specific strategy.
Can indicators and chart settings be customized to fit a personal strategy?
Yes. Every indicator on the platform can be modified in terms of color, line thickness, calculation method, and applied timeframe. This flexibility means two traders using the same indicator can configure it entirely differently based on their trading style. Scalpers might favor faster-reacting settings, while swing traders often prefer smoothed, longer-term calculations. This adaptability is one of the reasons the platform remains popular across such a broad range of trading approaches.
What timeframes are supported for analysis?
The platform supports a comprehensive range of timeframes, from short intraday intervals to longer-term weekly and monthly views. This range allows traders to study price behavior across multiple time horizons without switching software. A common approach involves reviewing a higher timeframe to establish overall market context, then narrowing down to a shorter timeframe to refine entry and exit timing. Multi-timeframe analysis like this is widely regarded as a disciplined way to reduce guesswork in trading decisions.
What are analytical objects, and why do they matter?
Analytical objects are the drawing and annotation tools available directly on the chart, including trendlines, channels, geometric shapes, and Gann or Fibonacci tools. These objects let traders visually map out patterns, key levels, and potential turning points. Rather than relying solely on indicator output, traders can combine visual pattern recognition with technical calculations, creating a more rounded view of market structure. This combination often leads to more informed, confident decision-making.
Is this platform suitable for both beginners and experienced traders?
Absolutely. New traders benefit from the platform’s clear layout and the ability to start with simple chart types and a handful of indicators. As confidence grows, traders can gradually introduce more advanced analytical objects and multi-timeframe strategies. Experienced traders, meanwhile, appreciate the depth and customization available, allowing them to build highly specific, strategy-driven setups.
Charting tools shape how traders interpret the market, and having a platform that supports detailed, customizable analysis can meaningfully improve decision-making over time. Whether reviewing long-term trends or fine-tuning short-term entries, the right combination of indicators, timeframes, and analytical objects brings structure to what can otherwise feel like an unpredictable market.
Key Points
- The mt5 trading platform is recognized for its advanced charting capabilities and user-friendly interface, which facilitates trader confidence.
- Traders utilize various chart types including candlestick, bar, and line formats to interpret price action effectively.
- The platform offers a wide library of customizable technical indicators, allowing traders to apply multiple tools simultaneously to confirm signals.
- Traders can modify indicators in terms of color, calculation methods, and timeframes, tailoring them to individual trading styles.
- The platform supports a comprehensive range of timeframes, enabling multi-timeframe analysis for better trading decisions.
- Analytical objects, such as trendlines and Fibonacci tools, allow traders to visually map patterns and key levels on charts.